| About Us |
| News |
| Research |
| People |
| International Cooperation |
| Education & Training |
| Societies & Publications |
| Papers |
| Industrial System |
| Sitemap |
| Contact Us |
 |
 |
 |
 |
 |
 |
 |
 |
 |
 |
| Location: Home > News > Events |
| Microenvironments Studied for Next-Generation Suitability |
|
|
Facilitating next-generation technology nodes will require microenvironments to maintain low oxygen and relative humidity levels. This study details permeability, diffusion and solubility coefficients to estimate the performance characteristics of a real polycarbonate microenvironment.
S.I. Moon, L. Monson, Y. Liu, M. Fuller and C.W. Extrand, Entegris Inc., Chaska, Minn. -- Semiconductor International, 11/1/2009
Polycarbonate (PC) is an amorphous engineering thermoplastic used in a wide variety of applications. Within the semiconductor arena, it is used for containers or microenvironments (MEs) that protect and transport critical materials, such as silicon and ceramics, as they are converted from raw wafers or disks into ICs or rotating memory. In the past, moderate humidity and oxygen found in ambient air were usually benign. Today, some IC manufacturing technologies have advanced to the point where even the water and oxygen in air can be detrimental, causing time-dependent haze or corrosion.1,2 Purging with an inert gas is one method for lowering water or oxygen levels inside MEs. However, once the purge gas stops flowing, oxygen and water levels quickly rise. After purge, the relative humidity (RH) inside a traditional PC wafer microenvironment can reach 30% within several hours, for example. The post-purge rise in oxygen and water may have multiple causes: permeation from the exterior, leakage, or desorption from the materials of construction. Engineering a solution requires knowledge of the mass transport coefficients of the ME materials of construction. In this paper, we describe measurements of the mass transport coefficients of oxygen and water through PC. Subsequently, these coefficients were used to estimate drying times to remove absorbed oxygen or water, breakthrough times for oxygen or water, initial permeation rates, and post-purge humidity rise of a 300 mm front opening unified pod (FOUP) constructed from PC. Analysis RH was calculated as ratio of water vapor pressure (p) to saturation water vapor pressure (psat) at a given temperature:
Vapor permeates through homogeneous materials by first dissolving and then diffusing.3 The downstream pressure rise (pl) of the permeant can be converted to an equivalent volume of gas (q) at standard temperature and pressure (STP):
where T is the measurement temperature, V is the volume of the downstream side of the permeation apparatus, T0 is standard temperature (0°C = 273 K) and p0 is standard pressure (1 atm = 76 cmHg). The volume (q) of gas that permeates through a film with time (t) under steady state conditions depends on the permeability coefficient (P), as well as film thickness (B), film area (A) and the applied upstream pressure (ph):3,4
The time required for a permeant to break though a film (tb) depends on the film thickness (B) and the diffusion coefficient of the material:4
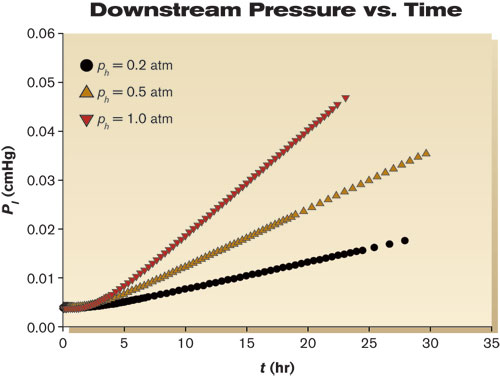
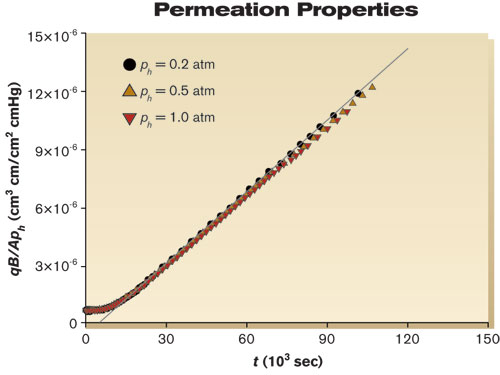
The PC evaluated in this study was extruded film from GE (now Sabic, 8010-MC-112). Mass transport coefficients were measured according to standard manometric procedures5–8 as described below. The permeation apparatus consisted of a sample holder inside a temperature-controlled chamber, a series of valves, an upstream ballast tank, a pressure gauge for the upstream gas or vapor, and a downstream solid-state manometer (10 Torr MKS Baratron Type 628B). The apparatus was constructed from stainless steel. Connections were made by welding or with VCR flanges to minimize leaks. Data acquisition and control were performed remotely. A circular specimen with a diameter of 4.6 cm and an effective area (A) of 13.7 cm2 was placed in a permeation apparatus. The apparatus was pumped down to ~3×10⁻³ cmHg and held overnight to remove volatile constituents from the apparatus and the specimen. The next day, the apparatus was leak tested. If the leak rate was sufficiently low (typically ~2×10⁻⁸ cmHg/sec), then the upstream side of the apparatus was charged with either oxygen gas or water vapor. After pressure and temperatures were allowed to equilibrate for a few minutes, the test was started. The downstream pressure rise (pl) was recorded with the passage of time. Temperature and upstream pressure (ph) also were monitored over the duration of the experiment to assure their constancy. Measurements were made with samples having a thickness of 0.25 and 0.51 mm at 25°C. Given the uncertainty of the temperature, the pressures, the downstream volume and the dimensions of the polymer specimen, the uncertainty of our mass transport measurements was estimated to be 3-5%. Mass transport properties Figure 1 shows an example of raw data obtained from a 0.51 mm thick PC specimen exposed to three different upstream pressures of oxygen gas: 0.2, 0.5 and 1.0 atm (15, 38 and 76 cmHg). Initially, the downstream pressure remained constant. Once oxygen broke through the sample, the downstream pressure began to increase. Eventually steady state was established, where permeation rates were proportional to the applied upstream pressure. Note that the lag time from the three different pressures was the same. These data can be rearranged to calculate permeation properties using Equation 3 (Fig. 2). The points are experimental data, and the solid line represents linear regression from longer times. The slope of the line is equal to the oxygen permeability coefficient (P), which for this film had a value of 1.2×10⁻¹⁰ cm3•cm/cm2•sec•cmHg. The breakthrough or lag times (tb) were estimated from the intersection of two lines — the first defined by the permeability coefficient and the second a zero slope dashed line passing through the initial pl at t = 0 sec. For the data in Figure 2, tb = 11,000 sec (~3 hr), which corresponds to a diffusion coefficient of 3.8×10⁻⁸ cm2/sec. From the quotient of P and D (Eq. 5), the solubility coefficient was estimated as 3.3×10⁻³ cm3/cm3•cmHg. If analyzed individually, data from each of the pressures gave nearly identical values of P, D and S. The various thicknesses gave nearly identical results for oxygen, and the permeation of water through PC showed similar behavior.
The permeability coefficient is an inherent material property that describes the normalized "flow" rate through a material. As the permeability coefficient is a product of D and S, the much greater solubility of water in PC led to a P value that was nearly three orders of magnitude larger for water than for oxygen. The measured values generally agreed with those previously reported.9-11 Estimates of product performance
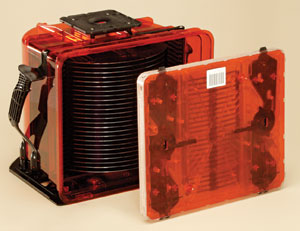
The mass transport coefficients listed in the Table can be used to estimate the performance of real products constructed from PC. In the following examples, we use an Entegris A300, which is a 300 mm FOUP (Fig. 3). The wafer columns and rear wafer retainer were removed so that this FOUP contains only unfilled PC. The A300 has an average wall thickness of 0.35 cm, an internal area of 5200 cm2, and internal volume of 25,700 cm3. The PC shell and inner door weighed 2830 g. The concentration of gas or vapor inside of an ME can be estimated from the quotient of gas or vapor that has diffused or permeated, and the volume of the ME:
Drying times — How long does it take to remove oxygen and water from an A300 FOUP? Desorption or outgassing from materials of construction is a potential contributor to oxygen and water inside of MEs. Two methods to minimize oxygen and water inside an ME would be to dry in a vacuum or to purge with an inert gas. We can use the mass transport coefficients to estimate how long this would take. The drying time (td) to reduce oxygen or water in the PC to a fraction (f ) of its original concentration depends on the part thickness (B) and the diffusivity (D) of PC:
In this case, we assumed the FOUP door was open during drying. From the solubility coefficients, we can estimate the amount of oxygen and water absorbed in PC under standard fab conditions. If in equilibrium with the fab surroundings, the PC in an A300 FOUP will contain ~130 cm3 (180 mg) of absorbed oxygen gas and 5040 cm3 (3.7 g) of water vapor. To reduce these oxygen levels to one-tenth of the original values would require eight days of pumping under a full vacuum. To reach the same level for water would require more than five days. To reduce the oxygen and water levels in the PC to one-hundredth, the drying times for oxygen and water would be more than 16 and 11 days, respectively. Increasing the temperature during the drying cycle could significantly decrease these times by boosting the diffusivity.12 Breakthrough times — After oxygen or water has been removed, how much time would pass before oxygen or water would begin to reappear on the inside of a closed 300 mm A300 PC FOUP? Equation 4 can be used along with the average wall thickness and diffusion coefficients to estimate breakthrough times (tb). Assuming we have a perfect seal and the closed, dry FOUP is exposed to ambient fab air, oxygen and water levels inside the FOUP would begin to climb within a week — six days for oxygen and four days for water. Thus, if oxygen or moisture levels inside of this FOUP climb significantly in minutes or hours, we can conclude that this post-purge rise is not caused by permeation from the external environment, but is likely due to seal leakage or desorption from the materials of construction. Initial permeation rates — Once oxygen or water breaks through to the interior of a pre-dried A300 FOUP, how quickly would their concentrations rise? The initial rate of concentration rise (Ċ) inside the "empty space" of a fully purged ME due to permeation from the external environment depends upon the permeation rate and the volume of the ME. Combining Equations 3 and 6 gives us our working equation:
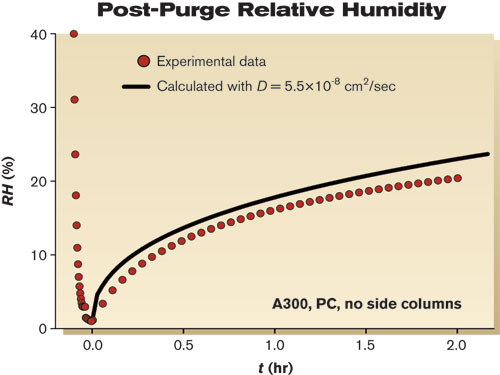
By inputting the appropriate partial pressure, permeability coefficient (P), area and volume into Equation 8, we can estimate initial concentration rise inside the freshly degassed A300 FOUP with a perfect seal. The anticipated rate for oxygen is 4.4×10⁻⁶ cm3/cm3•hr, and for water is 2.6×10⁻⁴ cm3/cm3•hr (or in terms of RH, ~1%/hr). The rate for water is much higher, due primarily to the much greater solubility of water in PC. Note that as time passes and the concentration inside the ME rises, the driving force (i.e., the partial pressure differential between the inside and outside of the FOUP) will diminish. With enough time, the concentration of oxygen and water inside the FOUP will reach the level of the fab environment. Post-purge rise of moisture — Extensive drying of ME materials of construction with inert gases or vacuum may not be a practical method of protecting critical materials from oxygen or water. A more practical alternative is purge, where the internal volume of an ME is flushed with an inert gas for a short period to reduce oxygen and water levels. If the A300 FOUP has not been pre-dried, how quickly would levels climb after purging? An answer to this question is shown in Figure 4. An A300 FOUP was conditioned in air under typical fab conditions (T=25°C and RH=45%) for several weeks with the door open. The door was closed and the FOUP was purged with nitrogen gas for 130 sec at a rate of 35 L/min to reduce RH to 1%. Once the flow of purge gas was stopped, RH rose rapidly, climbing to almost 7% in 10 minutes. As more time passed, RH increased more slowly, reaching 20% within two hours. Given enough time, the RH inside the FOUP would have eventually equaled that of the ambient environment, 45%.
Agreement between the measured and predicted values was quite good. Therefore, we conclude that the post-purge rise in RH was dominated by desorption of water from its PC structure. For this FOUP, although the seal may not have been perfect, it was more than adequate to impede the entry of water from the ambient environment over the course of the experiment.14 The purge for the example shown in Figure 4 was quite short. Longer or more aggressive purging significantly depletes the amount of dissolved oxygen and water in a conditioned FOUP. Consequently, the post-purge rise is slower. Because Equation 9 assumes that the concentration of oxygen and water dissolved in the PC remains constant during purge, estimates for long purge times overestimated post-purge rise. All examples given here were based on a single-part geometry and material. We have successfully used this approach to deconvolute the pieces of the permeation puzzle for other part geometries and materials. Conclusion Permeability, diffusion and solubility coefficients of oxygen gas and water vapor were measured for PC at 25°C. With similar molecular size, oxygen and water had similar diffusivity. However, water has a much greater affinity than oxygen does for PC, so water exhibited a faster permeation rate. These inherent material properties were used to estimate the performance of an ME constructed from PC. Calculations gave realistic estimates of drying times in vacuum, breakthrough times, permeation rates and post-purge RH rise due to desorption from the ME materials of construction. Overall Averages of Oxygen and Water Permeability Coefficients (P), Diffusion Coefficients (D) and Solubility Coefficients (S) for PC at 25°C
|


